- Léonce Ndikumana
- Dans Revue d’économie du développement 2014/HS02 (Vol. 22), pages 99 à 124
1 – Introduction
There are sufficient reasons to believe that Africa is at a crossroads today; and that it may be experiencing a historical turnaround, with unprecedented positive prospects, albeit with important challenges. The story of Africa changed at the turn of the century from that of hopelessness to exuberance in the face of yet another African renaissance. [2] In the 1980s and 1990s, Africa’s dismal growth performance made the headlines as ‘Africa’s growth tragedy’ (Easterly and Levine, 1997) and the ‘economic tragedy of the 20th century’ (Artadi and Sala-i-Martin, 2003); and the era was dubbed ‘the lost decades’ (Bates, Coatsworth, and Williamson, 2007). The overall macroeconomic performance has improved substantially since the turn of the century, characterised by higher GDP growth rates and an improvement in macroeconomic balances. The average GDP growth rate for the continent increased from 2.5% over the period of 1990-99 to 4.8% over 2000-07 before the global recession. [3] And even during the global recession of 2008-09, African countries performed much better than other regions, thanks, to a great extent, to the expanded policy space before the recession which enabled counter-cyclical policies to absorb external shocks (Brixiova and Ndikumana, 2013; Kasekende, Ndikumana, and Brixiova, 2010). Today African economies are dubbed as “lions on the move”, in the footsteps of the East Asian Tigers; and it is argued that the continent’s new growth resurgence has ‘likely staying power’ (McKinsey Global Institute, 2010).
Despite this growth resurgence of the past two decades, serious challenges remain. Africa is still saddled with very high and stubborn poverty rates, as well as high and often increasing levels of inequality. Growth has not trickled down to the majority of the population; therefore, it may be too soon to celebrate victory. One of the fundamental problems still faced by African economies is that they have not been able to sustain high growth rates for a sufficiently long time to generate meaningful gains in poverty reduction. Hence, the key growth challenges remain to raise growth, broaden the growth base, and sustain growth over an extended period.
One of the structural constraints to growth in most African countries is the low level of domestic investment. While the economic profession has primarily focused on private investment, evidence in fact shows that low and declining public investment may be a bigger problem for African economies. And one of the reasons for the low levels of domestic investment is the shortage of domestic financing, especially long term investment capital.
Yet, the African continent presents a stunning paradox. On the one hand, the majority of African countries exhibit chronic and even deepening investment-saving gaps. On the other hand, the continent is also a source of large and increasing volumes of unrecorded capital outflows or capital flight. It is estimated that over the past four decades the continent has lost up to $1.3 trillion through capital flight (Boyce and Ndikumana, 2012; Ndikumana and Boyce, 2012). This amount does not include all forms of illicit financial flows from the continent. The phenomenon of capital flight is not new, and it seems to be worsening even as economic conditions appear to be improving in the continent. In particular, the recent resource booms have coincided with dramatic increase in capital flight.
Capital flight from African countries is facilitated by the proliferation of secrecy jurisdictions, safe havens or tax havens that provide opportunities for transfer and concealment of illicit capital. This includes proceeds of embezzlement of natural resource exports, tax evasion, corruption, transfer pricing, and outright smuggling of capital out of African countries. Therefore, any discussion of the problem of capital flight must pay serious attention to the role of tax havens.
This paper examines the implications of capital flight and tax havens for economic development in African economies. It discusses how capital flight presents a serious development problem for African economies and highlights the role of tax havens in facilitating capital flight from the continent. Then the paper investigates empirically the impact of capital flight on domestic investment and the opportunity costs of capital flight in terms of foregone growth. The analysis is based on a sample of 39 African countries with available data on capital flight from 1970-2010 published by the Political Economy Research Institute at the University of Massachusetts at Amherst (http://www.peri.umass.edu/300). Two empirical exercises are undertaken. First, econometric analysis is used to assess the impact of capital flight on total domestic investment and on private domestic investment. The paper motivates the reason for focusing on domestic investment in the case of African countries. Second, drawing on the financing gap model following the work in the African Economic Outlook 2012 and Nkurunziza (2013), a simulation exercise is undertaken to estimate the potential gains in terms of growth that could be derived from investing capital flight domestically. The empirical evidence is used to draw some policy implications.
2 – Capital flight, a serious development problem in Africa
A chronic and worsening problem
The attention to the problem of capital flight from Africa and other developing countries has picked up recently both in academia as well as in the policy circles. Interest in the issue has been stimulated by new empirical evidence showing a large and growing magnitude of the financial haemorrhage suffered through capital flight and illicit financial flows in general (AfDB and GFI, 2013; Henry, 2012; Ndikumana and Boyce, 2011a). In the policy arena, the interest in the problem of capital flight is motivated by the realisation that these large amounts of illicit financial outflows present a severe constraint to global efforts to mobilise financing to assist developing countries in their quest to conquer hunger, endemic diseases and other development challenges.
The problem of capital flight from Africa is, however, not new. Moreover, the evidence shows that the problem is getting worse. Studies initiated since the early 1990s documented large amounts of capital flight from African countries (Ajayi, 1997; Ajayi and Khan, 2000; Chang and Cumby, 1991; Hermes and Lensink, 1992; Kahn, 1991; Murinde, Hermes, and Lensink, 1996; Wood and Moll, 1994). More recent studies show that illicit outflows from the continent have accelerated over the past two decades in the midst of resource booms and growth resurgence. It is estimated that between 1970 and 2010, African countries have lost up to $1.3 trillion (in 2010 dollars) through capital flight. This figure is the sum of capital flight from 35 sub-Saharan African countries (from Boyce and Ndikumana (2012)) and 4 North African countries, namely Algeria, Egypt, Morocco and Tunisia (from Ndikumana and Boyce (2012)). Table 1 provides estimates of the amount of capital flight from the 39 countries. The results presented were estimated using the standard Balance of Payment ‘residual’ method extended to include capital flight through trade misinvoicing and unrecorded workers remittances. Detailed explanations of the algorithm are provided in Ndikumana and Boyce (2010).
Table 1
Capital flight from 39 African countries, 1970-2010
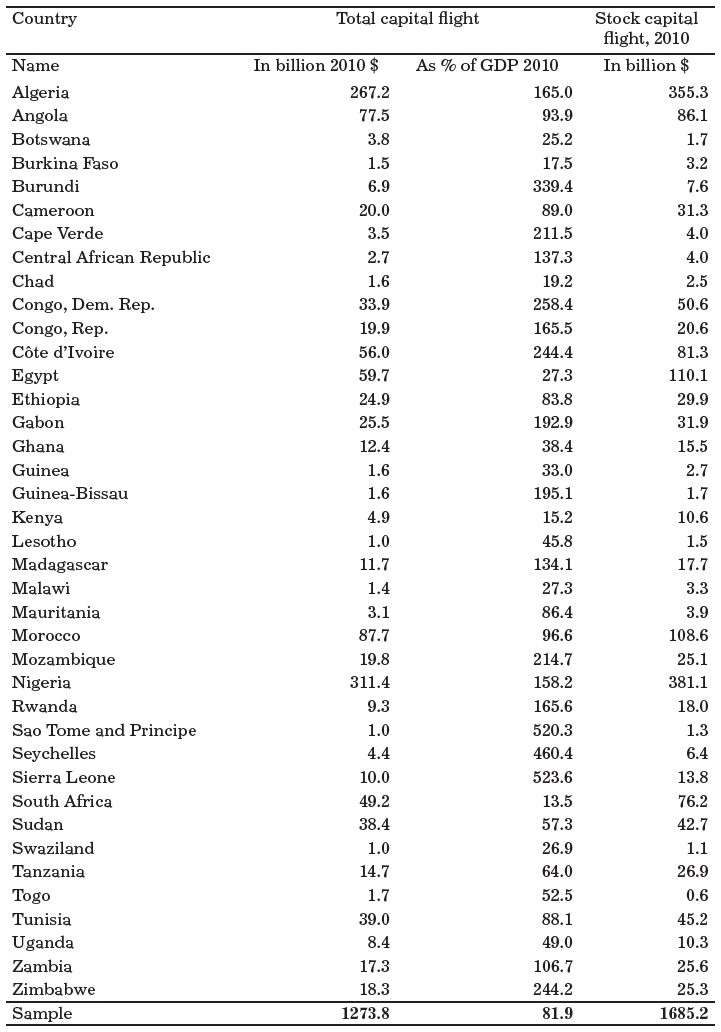
Source: Data on capital flight are from PERI (www.peri.umass.edu/300); data on GDP are from the World Bank’s World Development Indicators (online).
Past capital flight is invested in various forms of assets that generate returns for the asset holders. Considering a modest interest rate corresponding to the US Treasury bill rate, it is possible to estimate the stock of capital flight including accumulated interest earnings. Even with this conservative estimate, the stock of capital flight from African countries is staggering. For the 39 countries in Table 1, the stock of capital flight amounted to $1.7 trillion in 2010. This makes this group of countries, and by extension Africa, a ‘net creditor’ to the rest of the world in the sense that this stock of capital flight vastly exceeds the stock of debt of $283 billion owed by these countries as of 2010.
There is, however, an important difference between these assets and liabilities. While the assets represented by capital flight belong to private Africans, external debts are liabilities of the African countries through their governments. Moreover, it has been demonstrated that a substantial amount of capital flight was in fact financed by these external debts through a ‘revolving door’ (Ndikumana and Boyce, 2003, 2011b). This raises a moral question of the responsibility of the debt burden that falls on the African people while some of the associated debts were not used for financing development programs. This issue is discussed in detail in Ndikumana and Boyce (2011a) who argue that such debts that financed capital flight are odious and should be repudiated.
The capital flight problem is worse in Africa than in other regions
The problem of capital flight is not unique to Africa. In fact the absolute volume of capital flight from Latin America and Asia is higher than outflows from Africa (Bedja, 2006; Collier, Hoeffler, and Pattillo, 2001; Henry, 2012; Pastor, 1990; UNDP, 2011). However, in relative terms, Africa suffers much higher costs from capital flight than its counterparts. Table 2 presents some comparative statistics for Africa and other developing regions from two studies, Collier et al. (2001) and Henry (2012). The two studies are selected because they are among the very few studies that cover representative samples from many regions, which enables us to compare Africa to other regions using statistics computed with the same methodology and covering the same time period. The evidence from these studies reveals two important empirical facts. First, it demonstrates that Africa has a much lower private capital stock compared to other regions. But at the same time, private Africans exhibit a ‘reverse home bias’ in the sense that they tend to hold a relatively higher fraction of their assets abroad compared to their counterparts in other regions. According to the data from Collier et al. (2001), 40 percent of Africa’s private capital was held abroad in the form of capital flight, the highest ratio of all developing regions. Secondly, capital flight represents a relatively more severe burden on African economies compared to other regions, both in terms of foregone output (Collier et al., 2001) and in terms of capital flight-to-GDP ratio (Henry, 2012).
Table 2
Unrecorded capital outflows from Africa compared to other regions

Source: The statistics on capital flight and external debt for 2010 are from Henry (2012); the statistics for capital flight for 1990 are from Collier et al. (2001); data on GDP used to calculate the ratios are from the World Bank’s World Development Indicators (online).
Capital flight also represents a more severe problem in Africa given that the continent faces relatively more pressing needs to accelerate progress in social development. Despite recent progress, the majority of African countries lag behind in key indicators of social development and they are not on track to meet major components of the MGDs (United Nations, 2013). Sub-Saharan Africa not only has the highest poverty rates in the developing world, but it is also the only region where the number of poor people continues to increase – from 205 million in 1981 to 414 million in 2010 – despite a slight decline in the poverty headcount ratio. [4] Progress in health and access to basic social infrastructure such as clean drinking water and modern sanitation facilities also lags both behind target and behind other developing regions. For these reasons, leakages of scarce resources through capital flight represent a higher economic and human cost for Africa than other developing regions.
How do we explain capital flight from the continent?
An important empirical question is what causes capital flight from African countries. This question is important because understanding the causes of capital flight is essential for designing appropriate policies to prevent it. It is often claimed that capital fight is the outcome of actions by rational African savers/investors who move their capital out of their countries in search for higher returns or for safety. In particular, some claim that capital held domestically faces financial risk due to currency depreciation, devaluation, inflation, and financial instability (Dornbusch, 1985), or political risk such as the risk of expropriation (Kant, 2002; Khan and Haque, 1985), or risks due to uncertainty of future tax policy, notably potential increases in taxation, or poor economic governance especially undermining debtor rights (Eaton, 1987). This line of argument suggests that the risk-adjusted rates of returns to investment would be the main determinant factors behind capital flight.
There are serious conceptual and empirical problems with this explanation of capital flight based on portfolio choice theory. First, we expect that considerations of risk and returns on investment would guide the decisions concerning honestly acquired wealth where owners decide on the domiciliation of their capital so as to maximise expected risk-adjusted returns. However for stolen money and other illicit capital, these considerations are secondary to the need to conceal the assets and evade prosecution. In fact, the holders of stolen assets may be willing to accept low and even negative returns to their investments in exchange for the protection that banking secrecy jurisdictions and tax havens provide. Secondly, there is little empirical evidence to support the portfolio choice view of capital flight as advanced in some studies (as in Collier et al. (2001) and Collier, Hoeffler, and Pattillo (2004)). Studies that use econometric analysis to uncover a relationship between capital flight and indicators of risk-adjusted returns to investment in the case of African countries find no conclusive evidence for the portfolio choice motive (Ndikumana and Boyce, 2003, 2011b). This leads to suspect that to a large extent capital flight is driven by illicit motives. Therefore, it cannot be addressed solely by relying on policies aimed at raising the domestic return to investment in African countries.
3 – The role of tax havens and secrecy jurisdictions
A discussion on capital flight from African countries must consider the role of tax havens, or safe havens, or secrecy jurisdictions, or offshore financial centers (OFCs) for many reasons. First due to the services that secrecy jurisdictions offer to capital holders, they facilitate the transfer and concealment of capital including illicitly acquired funds. While developed countries have also raised concerns over revenue losses through profit shifting, transfer pricing, tax avoidance and other illicit transactions facilitated by tax havens (Bartelsman and Beetsma, 2003; Sikka and Willmott, 2010), it is estimated that developing countries are more vulnerable to the impact of safe havens (Hampton and Christensen, 2010; Hebous and Lipatov, 2013; Shaxson, 2011). This is more so for African countries that face more development financing constraints but also have weaker capacity to address the problem of illicit financial flows towards safe havens.
There are also important distributional and equity issues that justify attention to safe havens. First, it is expected that the private Africans who take advantage of safe havens to conceal illicit wealth are members of the economic and political elites. As they do not pay taxes on these assets, they are able to accumulate wealth even faster. This deepens the gaps between the poor and the wealthy, thereby worsening income inequality in African countries. In fact, it can be argued that given the massive amounts of wealth that are channeled through safe havens, and therefore not incorporated in national income and expenditure accounts, it is likely that the standard measures of inequality and cross-country distribution of wealth are substantially biased downward (Zucman, 2013).
The attention to tax havens is further motivated by the linkages with corruption both in African countries and abroad. Secrecy jurisdictions provide a safe haven for corrupt rulers to hide stolen assets, including funds obtained through embezzlement of the proceeds from natural resource exploitation and trade. It is estimated, for example, that 8 percent (if not more) of the petroleum rents earned by oil-rich countries with weak institutions end up in private accounts in OFCs (Andersen, Johannesen, Lassen, and E., 2012; Hebous and Lipatov, 2013). Thus, tax havens indirectly undermine governance by facilitating the transfer and investment of corruption-related funds (Torvik, 2009). The abuse of tax havens for concealment of illicitly-gotten wealth and for tax evasion undermines tax morale through negative demonstration effects (Fjeldstad, Schulz-Herzenberg, and Sjursen, 2012). Naturally if the political and economic elites are not paying their taxes, the ordinary residents have less incentive to honor their tax obligations.
The foregoing discussion implies that the analysis of capital flight from African countries and illicit financial flows in general must seriously consider the role played by safe havens. Unlike the connotation that the word invokes, safe havens are actually not remote exotic islands in the middle of nowhere. The biggest offshore financial centres are major capital cities in developed countries. This implies that for African countries to make headway in addressing the problem of capital flight, they will need strong cooperation and support from their development partners who host the major banking secrecy jurisdictions and tax havens.
4 – Impact of capital flight on domestic investment
Why focus on the capital flight-domestic investment nexus?
In examining the implications of capital flight for economic development in Africa, it is important to pay close attention to the linkages between capital flight and domestic investment. This is because of the critical role played by domestic investment in the growth process. Indeed the economic literature has accorded a prominent role to domestic investment as a key driver of long-run economic growth. According to the Solow growth model, long-run growth results fundamentally from capital accumulation (Solow, 1956). Empirical studies have demonstrated that investment is the most robust determinant of long-run growth (Levine and Renelt, 1992). The seminal study by De Long and Summers (1993) documented the critical role of equipment investment for building productive capacity in the economy, raising productivity and driving economic growth. The authors find a strong cross-country association between growth of output per worker and investment in machinery and equipment. In fact their study finds that poorer countries benefit as much as, if not more than, developed economies from investment in machinery and equipment. They conclude that “rapid growth is found where equipment investment is high, and slow growth where equipment investment is slow” (De Long and Summers, 1993, p. 396).
The existing empirical evidence in the literature demonstrates that the ability of a country to achieve and sustain high growth rates is contingent on its ability to achieve and sustain high levels of domestic investment. This is clearly illustrated in the case of the newly industrialised countries where growth has been predominantly investment-led (Rodrik, 1995; Young, 1995). In contrast, the low domestic investment in Africa has been singled out as a major reason for slow growth in the continent throughout the 1980s and 1990s (Collier and Gunning, 1999).
The predominant role of domestic investment for long-run growth has also been supported by country level analysis. For example, in a study on South Africa, Fedderke, Perkins, and Luiz (2006) find that investment in infrastructure is not only positively associated with economic growth, but that it also leads growth, implying that the relationship runs from infrastructure investment to growth. The evidence suggests that infrastructure investment drives growth directly as well as indirectly, notably by raising marginal productivity of private capital.
Given that domestic investment is an important and robust driver of long-run growth, it follows that any factor that stimulates domestic investment is good for growth. Symmetrically, any factor that hinders domestic investment is a constraint to growth. It is in this context that a study on the impact of capital flight must take a close look at the links between capital flight and investment. Specifically, it is important to examine whether capital flight indeed has a negative effect on domestic investment in African countries.
Econometric evidence on the impact of capital flight on investment
Drawing on the foregoing discussion, econometric analysis is used to explore the effects of capital flight on domestic investment in African countries. The analysis is based on a sample of 39 African countries for which there are time series data on capital flight over the period 1970-2010. The list of these countries is given in Table 1. Data are averaged over 5-year non-overlapping periods to smooth out annual fluctuations. [5]
Capital flight can have an impact on domestic investment in several ways. First, the leakages of capital out of the country amount to a depletion of domestic saving – both private and public saving – which reduces domestic capital formation. The linkage between domestic investment and saving can also be motivated by imperfect capital mobility, especially given the limited access to global capital markets by African countries. Hence, in the spirit of Feldstein and Horioka (1980), we can expect a close long-run relationship between domestic investment and domestic saving in the region. The analysis in this paper tests whether capital flight has an additional explanatory factor in an investment model where investment is assumed to be constrained by domestic saving.
The second possible reason for an impact of capital flight on domestic investment is through macroeconomic uncertainty. High capital flight is seen by private agents as a sign of failure of macroeconomic policy and institutions in charge of economic regulation. In that respect, private capital would flee insecurity and high sovereign risk at home. Moreover, high capital flight raises the risk of government insolvency as a result of erosion of the tax base (through flight of private wealth) as well as embezzlement of public resources (corruption-induced capital flight). As a result, private agents would be concerned about higher future taxes, inducing a flight to safety abroad. Therefore the demand for domestic assets would decline, leading to lower private domestic investment. The depletion of public revenue would cause a decline in public investment. The overall effect is a decline in total domestic investment.
The econometric model used to test the impact of capital flight on investment also takes into account key factors that have been demonstrated to be strong determinants of investment. The first determinant of investment considered is financial development, especially the availability of credit to the private sector (Ndikumana, 2000, 2005). However, as both domestic saving and bank credit measure the availability of domestic financing for investment and therefore may be correlated, they are entered separately (alternatively) in the estimation equation. We therefore have two alternative estimation equations, one with domestic saving, and the second with domestic bank credit to the private sector. The model also includes trade and the terms of trade to capture the impact of access to global factor and output markets as well as the effects of shocks to import and export prices.
The two estimation models (with domestic saving or credit to the private sector) are specified as follows:


Inv is alternatively total gross fixed capital formation (total domestic investment) and private gross fixed capital formation (private investment) as a percentage of GDP, KF is capital flight as a percentage of GDP, GDS is gross domestic saving as a percentage of GDP, credit is domestic bank credit to the private sector as a percentage of GDP, Trade is the sum of imports and exports as a ratio of GDP, TOT is an index of terms of trade,  is a term that captures omitted but potentially important country-specific factors of investment, and
  is a random error term.
Equations (1) and (2) above are estimated by taking into account possible bias of the estimates due to outliers using the iterated reweighted least square method (IRLS), country specific effects using the fixed-effects estimation method, and potential endogeneity of the regressors using the system generalised method of moments (GMM). Using this variety of methods enables us to assess the robustness of the results.
The regression results for total domestic investment are presented in Table 3 and those for private investment are reported in Table 4. In each table, columns 1-3 present results for equation (1), which includes domestic saving as a regressor while columns 4-6 report results for equation (2), which includes domestic credit to the private sector.
Table 3
Impact of capital flight on domestic investment

Notes: The dependent variable is gross fixed capital formation as a percentage of GDP. P-values are given in parentheses. Significance level: *** p < 0.01, ** p < 0.05, * p < 0.1.
Table 4
Impact of capital flight on private investment

Notes: The dependent variable is private fixed capital formation as a percentage of GDP. P-values are given in parentheses. Significance level: *** p < 0.01, ** p < 0.05, * p < 0.1
As can be seen from the results, capital flight has a negative effect on domestic investment. In the case of total domestic investment (Table 3), the coefficient on capital flight is negative and statistically significant. In the case of private investment (Table 4), the effect of capital flight is systematically negative and statistically significant in all the regressions. The magnitude of the effect is quite similar to the effect on total investment. Clearly capital flight has a negative and robust effect on private investment.
From these results we can conclude that capital flight has a negative and statistically significant effect on domestic investment and that this effect holds even when other important determinants of investment are accounted for in the specification. It also holds for both total investment and private investment. The results suggest that capital flight is one of the factors that have contributed to the chronically low domestic investment in African countries over the past decades.
5 – Simulation of opportunity costs of capital flight in terms of growth
Why focus on growth?
Despite the recent growth resurgence, Africa continues to lag behind other regions in social development. While poverty rates have declined in many countries, Africa is the only region where the number of poor is actually increasing. The continent also lags behind targets relative to other regions in other measures of social development including infant and maternal mortality, and access to social infrastructure services such as improved drinking water and modern sanitation facilities. Thirty-seven percent of Africans do not have access to an improved water source, and 567 million African people lack access to improved sanitation facilities (UN, 2013). The rural-urban divide is large, with 84 percent of the African people without access to potable water residing in rural areas (Salami et al., 2011). There is also a stark disparity of access by income, with only 60 percent of the poorest households in urban areas having access to water and sanitation compared to 90 percent for the wealthiest households. In rural areas, only a third of the poorest households have access to these services (WHO, 2013). Access to basic social services is still clearly a major challenge in Africa.
An important reason for the slow progress in social development is that the majority of African countries have been unable to achieve and sustain high levels of growth in the past. Growth has been erratic in many cases and anemic in a number of countries. It is therefore clear that the key to conquering poverty in Africa and improving access to modern social amenities is to raise growth and sustain high growth over a long period of time.
One of the major constraints to growth in Africa is low capital accumulation or domestic investment. Indeed low capital accumulation may be one of the reasons why some countries in Africa are caught in a poverty trap (Andrimihaja, Cinyabuguma, and Devarajan, 2011). Low domestic investment may be due to many factors. One of them is lack of adequate financing. As the evidence in the previous section demonstrated, one of the constraints to investment is capital flight. In other words, by depressing investment, capital flight undermines growth prospects in African countries. The analysis in this section aims to assess the losses in growth due to capital flight. The methodology used for simulating these losses is described below.
Simulation methodology
The simulation methodology used in this paper to estimate the impact of capital flight on growth draws from the view that investment is a key driver of long-term growth. In other words, increasing investment leads to higher growth. Following this logic, we estimate additional growth that would be gained from ‘capturing’ capital flight and investing it domestically. We follow the analysis in the African Economic Outlook 2012 (AfDB et al. (2012)) and Nkurunziza (2012, 2013). It is assumed that if capital flight was invested domestically, this would be a net increase in domestic investment which would raise the level of output to a higher level than the historical values or the status quo. It is also assumed that capital flight invested domestically would yield the same benefits as historical investment in terms of additional output. This is captured by the use of the incremental capital output ratio (ICOR) derived from historical values of domestic investment and GDP growth. The analysis draws from the financing gap model, which is widely used for forecasting and policy simulation in major national and international models including at the World Bank. There are two main concerns about this methodology (see Easterly (1999)). The first is that not every dollar of new investment yields extra growth, and the second is the assumption of a linear relationship between investment and growth embedded in the ICOR. The first concern can be addressed by using historical investment and growth data. Using historical investment and growth data also helps partly address the concern that some capital flight may be driven by bad policies and instability at home. In such circumstances, domestic investment would have low returns. Therefore, calibrating the returns of capital flight based on actual returns of domestic investment provides a conservative benchmark for the simulation of foregone growth due to capital flight. The second criticism is about the precision of point estimates; there is less of a concern about estimates of the average impact over a long period. Nonetheless, the simulation results should be interpreted with caution. They are only illustrative and do not provide a basis for a firm prediction of the impact of capital flight on growth. The simulations are useful in providing an order of magnitude rather than precise estimates of the impact.
The first step is to calculate the ICOR which measures the amount of investment required to produce one additional unit of output or GDP. For a country i at time t, given historical values for investment (I), GDP and GDP growth (g), the ICOR is calculated as:

Given that growth can be negative in some years for some countries, ICOR may also turn out to be negative, which does not have any empirical meaning. We therefore discard observations with a negative ICOR in the simulation. Moreover, ICOR may exhibit substantial year-to-year variations due to volatility of growth and investment, resulting in high volatility of the estimated impact on output. We address this problem by using medians of ICOR over a period of time rather than estimated annual values. Specifically, we use decadal medians of ICOR with the data organised in ten-year non-overlapping periods from 1970-2010, except for the last period which has 11 years (2000 to 2010).
Using equation (3) and assuming that capital flight would produce the same output per dollar as historical investment, the additional output resulting from investing capital flight domestically is obtained as follows:

Then, potential GDP, which is the level of output that would be achieved if capital flight was invested domestically, is obtained as:

The next step is to calculate the potential growth rate of output following investment of capital flight in the home country. In each year this potential growth rate is obtained by comparing potential output with actual (historical) output. Then over a given period of T years, we obtain the average additional annual growth rate of GDP arising from investing capital flight domestically as:

In our case T = 10 years in all periods except the last one (2000-10) where it is 11 years.
Simulation results
The results of the simulations by country are presented in Table 5 for the period 1970-2010 and in Table 6 for 2000-2010. Table 7 presents results by decade and country groupings into oil-rich and non-oil rich countries, and for SSA vs. North Africa. The tables present the average additional growth resulting from investing capital flight in Africa. Given the substantial volatility in ICOR and the resulting volatility in potential growth, we also present the median additional growth rate.
Table 5
Potential additional growth from investing capital flight in Africa, 1970-2010

Table 6
Potential additional growth from investing capital flight in Africa, 2000-2010

The simulation results show substantial opportunity costs of capital flight incurred by African economies. As can be seen from Table 5, over the 1970-2010 period, the sample of 39 countries recorded an average growth rate of 3.9. Over this period, investing capital flight domestically would have yielded an extra 2.4 percent annual growth rate on average, and a median incremental annual GDP growth of 0.8 percent. During this period, 17 countries would have grown faster by an average of 2% or more and 30 countries by 1% or more on average.
Over the period 2000-2010 (Table 6), the average actual GDP growth rate was 4.7 percent. Investing capital flight domestically would have raised growth by an additional 3% on average; the median incremental growth rate would have been 0.6%. [6] During this period, by investing capital flight domestically 11 countries would have increased growth by an average of 2% or more and 19 countries by 1% or more on average.
The results in Table 7 are also quite revealing. The first finding is that the estimated foregone output growth is higher in the last period (2000-10) than in the previous decades. For the sample as a whole, the potential additional GDP growth due to investing capital flight domestically would have been 3% during 2000-2010; the second highest is for the 1980s at 2.7%. [7] Secondly, the estimated opportunity cost is higher for SSA than North Africa (2.5% compared to 1.1%). Third, the potential gains are higher for oil-rich countries than non-oil countries. The oil-rich countries would have recorded an extra 3.9% GDP growth had they retained and invested capital flight domestically, the same for non-oil countries. The results raise concerns with regard to the observed explosion of capital flight during the last decade as shown in recent studies (AfDB and GFI, 2013; Boyce and Ndikumana, 2012; Ndikumana and Boyce, 2012). They imply that even as impressive as the post-2000 growth may have been, it actually could have been substantially surpassed if African countries had been able to keep all their capital onshore. Specifically, if African countries had been able to invest capital flight domestically, they would have been able to add an average of 3 percentage points (median of 0.6%) to their annual GDP growth rate in the past decade.
Table 7
Potential additional growth from investing capital flight in Africa, by decade and country group (Averages unless otherwise indicated)

6 – Conclusion
The analysis presented in this study shows that capital flight implies substantial opportunity costs for African economies. In particular, capital flight is an important constraint to domestic investment, which is especially problematic given the need to increase and sustain growth which is a condition for reducing poverty. Traditionally low domestic saving has been seen as the primary cause for low investment in African countries. The evidence presented in this study suggests that capital flight is an important factor of the shortage of investment capital in the continent. Therefore, in addition to designing mechanisms and incentives for increasing domestic savings as a means of stimulating domestic investment, African countries also need to establish measures to reduce capital flight. Curbing capital flight will help them substantially raise their growth rates, which in turn will contribute to accelerating progress towards reaching national development goals. In particular, higher growth rates will enable faster reduction of poverty which remains a challenge despite the observed improvement since the turn of the century.
Addressing the problem of capital flight from Africa requires action at the national, regional, continental and global levels. The strategy to combat capital flight must be organised along five dimensions: deterring illegal export of honestly acquired capital, addressing trade-related capital flight and tax evasion, recovering and repatriating stolen assets, tackling the revolving door and odious debt, and enforcing banking transparency and tax compliance in safe havens. This implies that African countries’ success in fighting against capital flight requires strong cooperation from their partners in the developed world where most of the capital flight is domiciled. Building a more transparent global financial system will benefit not only African countries but also all developing and developed countries.
Notes
- [1]Paper prepared for the European Development Network Conference on “Finance and Development” in Berlin on 11-13, 2013, jointly financed by the Agence Française de Développement (AFD) and German Ministry for Development Cooperation (BMZ).
- [2]See, among others AfDB, OECD, UNECA, and UNDP (2012), and UNECA (2013).
- [3]Calculated using data from the World Bank, African Development Indicators database (online).
- [4]The poverty data are from POVCALNET, at http://iresearch.worldbank.org/PovcalNet/index.htm?1.
- [5]The econometric estimation results are similar when annual series are used. Using pooled 5-year cross sections is especially advisable in the case of GMM estimation as it reduces the number of time periods.
- [6]Excluding Zimbabwe (which has an outlier growth rate in 2000-10), the average for the sample in the 2000-10 period is 2.5% and the median is the same (0.6%).
- [7]Excluding Zimbabwe, the average is 2.5% for 2000-10 and 2.7% (unchanged) for 1980-89.